Skip to content
Rakshitha M M

Selected Work

Projects

Two dashboards, two very different business questions — sales intelligence for retail leadership, and profitability analysis across products and cities.

01

Tableau

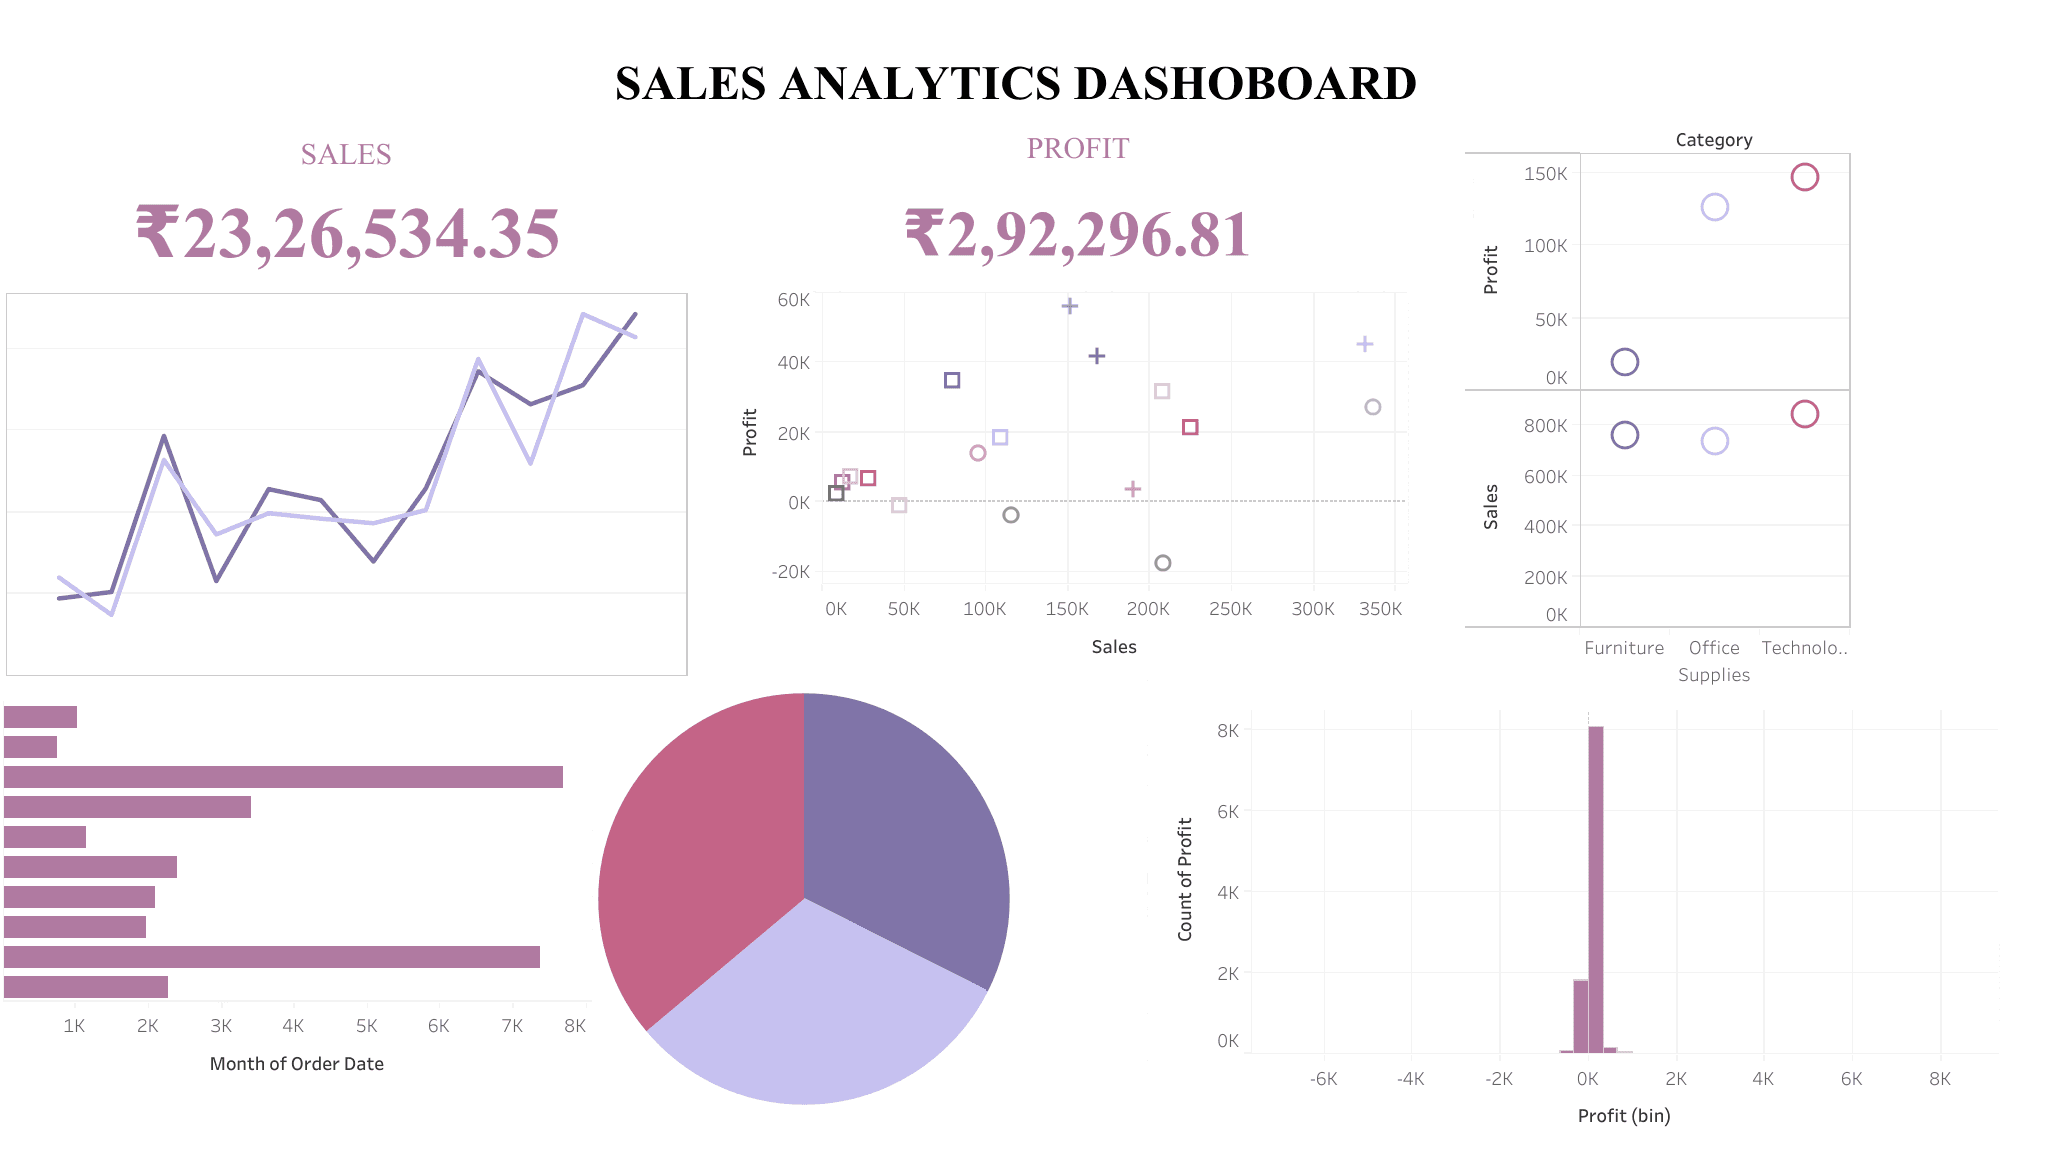
Executive Sales Intelligence Dashboard

An interactive Tableau dashboard analyzing over 10,000 retail sales records for executive-level decision-making.

Tableau DesktopTableau PublicExcelBusiness Intelligence

Business Problem

Leadership needed a single, reliable view of sales, profitability, regional performance, and customer trends — without waiting on static reports.

Approach

  • Consolidated over 10,000 retail sales records into a structured Tableau data model.
  • Built executive KPI dashboards covering sales, profitability, regional performance, and customer trends.
  • Implemented interactive filters and dashboard actions to make exploration self-service for business reporting.
  • Published the finished project on Tableau Public and GitHub for transparency and reuse.

Business Impact

Gave executives a self-service view into sales and regional performance, reducing reliance on one-off static reports.

02

Power BI

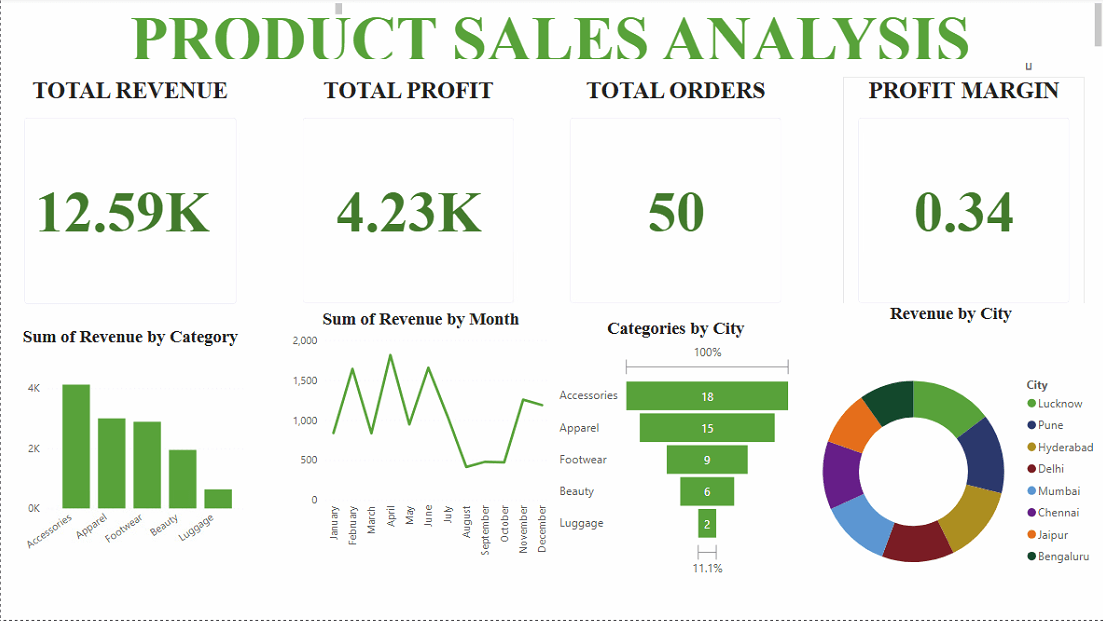
Product Sales Analysis Dashboard

An interactive Power BI dashboard analyzing revenue, profit, discounts, and city-wise sales performance.

Power BIDAXExcelData Analytics

Business Problem

The business needed clear visibility into which products, cities, and discount levels were actually driving profit — not just revenue.

Approach

  • Built an interactive Power BI dashboard analyzing revenue, profit, discounts, and city-wise sales performance.
  • Developed DAX measures and KPI cards for Revenue, Profit, Orders, and Profit Margin.
  • Created dynamic visualizations to identify sales trends and category performance.
  • Applied business intelligence concepts to support data-driven decision-making.

Business Impact

Surfaced city-wise and category-level profit drivers, enabling more targeted, data-driven sales decisions.